Transcript of DK Analytics December 19th, 2019 video
Topic: massive new money printing pushing stocks higher still
Trade weighted US$: 91.76; US 10-yr: 1.93%; S&P 500: 3,198; Oil: $61.00; Gold:$ 1,476; Silver: $17.07
One housekeeping issue: I’ve spent way too many off-hours trying to make sure I don’t lose my site! My extremely talented webmaster out of Bratislava is retiring at year’s end and I had to find “Plan B” (with his help) while also trying to find a substantially cheaper hosting solution with bigdaddy. I managed to get all the ducks to line up, taking another 70%-ish chunk out of my annual out-of-pocket related to the site, so I may publish (some) of my transcripts. This is the “pilot version,” for better or worse. And I don’t know if “that plane will ever fly again.” Just saying.
Prior to wading into the topic at hand, allow me a few political remarks as regards the impeachment hoax:
I’m referring to the totally political, utterly despotic, absolutely contemptible, completely separation of powers-eviscerating impeachment of a president that has NOT engaged in nor committed:
- Obstruction (Trump handed everything over to Muller’s “fine” team of hacks)
- Collusion (as the Mueller report concluded; the real collusion was between the FBI and Donald Trump’s opposition — that is, the DNC, Hillary, and a Trump-hating British intel officer — to hijack the election, rather than some conspiracy between Putin and Trump)
- A politically-driven quid pro quo as the transcript between the Ukrainian president and Trump clearly showed, which was in stark contrast to Biden’s public remarks in same arena in order to protect his son’s highly questionable business dealings in that country.
- Bribery; here, as elsewhere, the Dems did what they accuse Trump of doing. Great, go-on-the-offense Saul Alinsky tactics; makes for a great coverup to blame others for what you did. And this doesn’t even get into how Hillary and the DNC financed the utterly concocted Steele dossier whose utterly illegitimate findings, totally based on hearsay, were then put to work — with the crooked FBI top brass fully on board — to get a FISA warrant to illegitimately spy on US citizens.
Said differently, Trump has committed no treason, no bribery, no high crimes, and no misdemeanors (old, stouter definition). In short, there is NO constitutional reason to impeach him. If only the same could be said for the other side of the aisle at multiple levels, including, but not limited to, Obama-era elected officials, cabinet members, and top-level bureaucrats from the IRS to the CIA to the FBI and beyond.
If the mobster Dems succeed in their illicit impeachment endeavor either explicitly (drive the president from the WH, which won’t happen, given that the Senate is in Republican hands) or implicitly (by crippling the executive branch), then separation of powers/the rule of law/the Constitution will most likely be beyond repair if it isn’t already, and what’s left of the presumption of innocence, due process rights, privacy rights, property right protections, and freedom will also be lost. If they can do this to a sitting president, what can the despotic leftists do to you and me? If what they nearly succeeded in doing to Kavanaugh turns off other constitutionalists from even being considered for the SCOTUS, or Trump’s impeachment in the House effectively shuts down his ability to choose an originalist judge for the SCOTUS, … then we’ll have increasingly codified tyranny, which, in contrast to our current de facto fascism, would not exactly constitute a broad-based asset price levitating future, because of the related, even more detrimental threat to private property and what remains of codified freedom. For flavor, look at P/Es in Russia or Venezuela.
So far, the market has shrugged the illegitimate impeachment off much like a cocaine addict focused on nothing but his next ever bigger dose — in the market’s case, a massive, peerless liquidity injection.
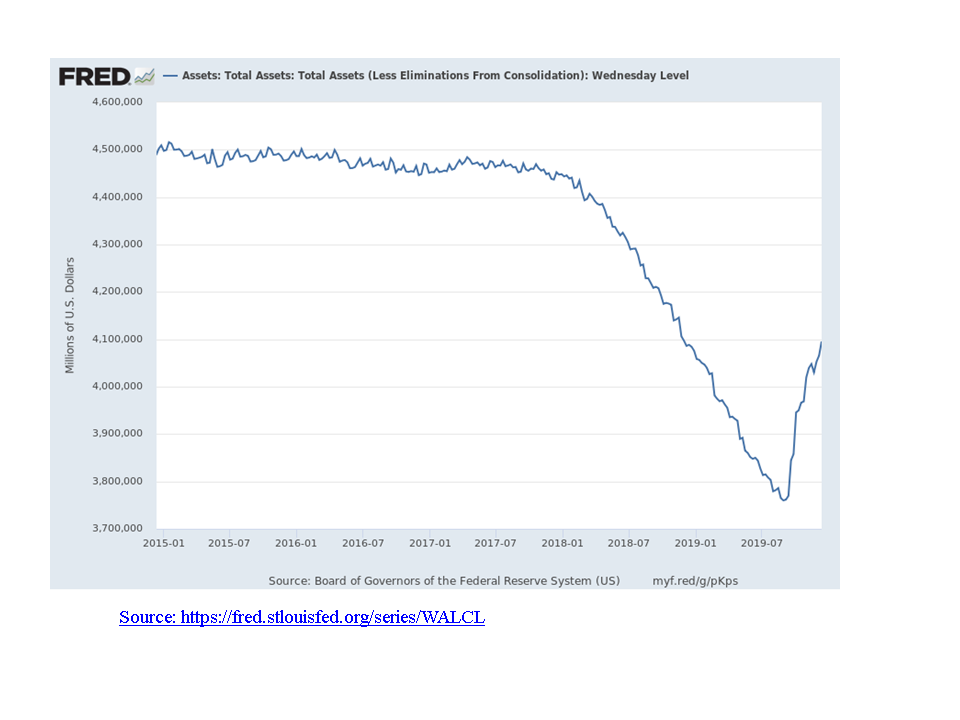
Well, the Fed hasn’t disappointed. The Fed’s balance sheet has ballooned by a breathtaking $325bn in three months to $4.095trn, or $108bn per month on average, which is far in excess of its most aggressive balance sheet expansion a few years back. If this $108bn p.m. rate were sustained for a year, which I think is highly likely, it would result in an unparalleled $1.3trn monetary base expansion, which itself would be the equivalent of 34% of the Fed’s balance sheet just three months ago, and would bring us to a record $5.1trn Fed balance sheet. Below a graphic illustration of the Fed’s rapidly re-inflating balance sheet courtesy of the St. Louis Fed (I improperly said the Cleveland Fed during the video):

Because of the productivity-eviscerating misallocations that money printing spawns, every additional dollar of debt has led to progressively lower GDP growth, something I have continued to flag in both posts and videos. In fact, during Q3:19, each additional dollar of debt resulted in only 24 cents of GDP growth; a few decades back, an additional dollar of debt brought a dollar’s worth of GDP growth. In an external financing-dependent/debt-dependent economy, Fed debasement in a fractional reserve banking system has boosted debt to ever more outrageous levels. Some numbers as of third quarter of this year that amply reflect this in the US are as follows:
- Total US debt (financial and non-financial) jumped by $1.1 trillion in Q3, ending September at $74.9 trillion, or a record 348% of GDP. YOY (year over year), total debt was up a stunning $3.2trn.
- Non-financial debt surged $835 billion to $53.9trn, or to a record 250% of GDP. YOY it was up a whopping $2.4trn, three times YOY GDP growth to Q3:19 of $792bn. Government, corporate, and consumer debt are growing and are all at record levels, even as home ownership is near multi-decade lows. BTW, tell me how some relatively robust job reports of late square with a $440bn increase in consumer debt YOY? How does one spell fake job reports, President Trump? Remember candidate Trump?
- Federal government borrowings rose at a 10.4% pace in the third quarter: federal debt grew by a whopping $1.3trn YOY thru the end of November! If you want to know the true US federal gov’t deficit, go here.
- The US M2 money supply surged an unprecedented $1.04trn over the past year, or by 7.3%, paced by a more robust money multiplier – I believe an inflation expectations-based increase, including trade ware fallout – and a dramatically widening Fed balance sheet as of early September conspired to bring this about.
Meanwhile, the biggest bubble progeny of the FED and other central banks, bonds and stocks, have surged YTD (year to date). With the FED returning to unprecedented currency debasement while driving the short-term rates down by repo hook or crook, the risk trade is on. BTW, the Fed has committed to purchasing over $500bn in repos in order to drive short-term rates down and to insure “cheap casino money” for Wall Street. With 2019 almost history, consider the following YTD returns with slender dividends and coupons on board, meaning it was “all about appreciation:”
- The S&P 500 has returned a whopping 30%
- The Nasdaq Composite is up a stunning 33%
- European stocks have been on a roll, with both the DAX and the FTSE returning in the mid-20% range
- US 10-year Treasuries have returned 14%
- And a basket of junk bonds (BoA high-yield index) is up 14%
- Gold and silver, meanwhile, while strong earlier in the year, are bringing up the rear with 15% and 10% dollar returns, respectively.
Against a backdrop of massively higher money creation and its ever more bloated cousin, debt, why aren’t silver and gold reflecting the ever-closer financial and economic train wreck? First, it’s risk on. Second, there’s a long and tired story that continues, until it doesn’t. I’m referring to the huge naked short positions in precious metals allowed and arguably even engineered by our fiat currency caretakers and their henchmen, naked short position which curiously wax whenever precious metals prices rise to any material degree.
This manipulation is well-documented but goes unpunished save for select “small-fine wrist slaps” for banks earning untold billions. Clearly, the powers that be want to keep fiat money up and real money down. My point: neither undeserved confidence in fiat money nor the huge naked short position manipulation DOWN of precious metals prices have ended. And, once again, it’s not a question of “if” they’ll end, only “when.” Quite the strategic allocation cue for the patient investor — until suddenly, he no longer needs to be patient, only “positioned.”
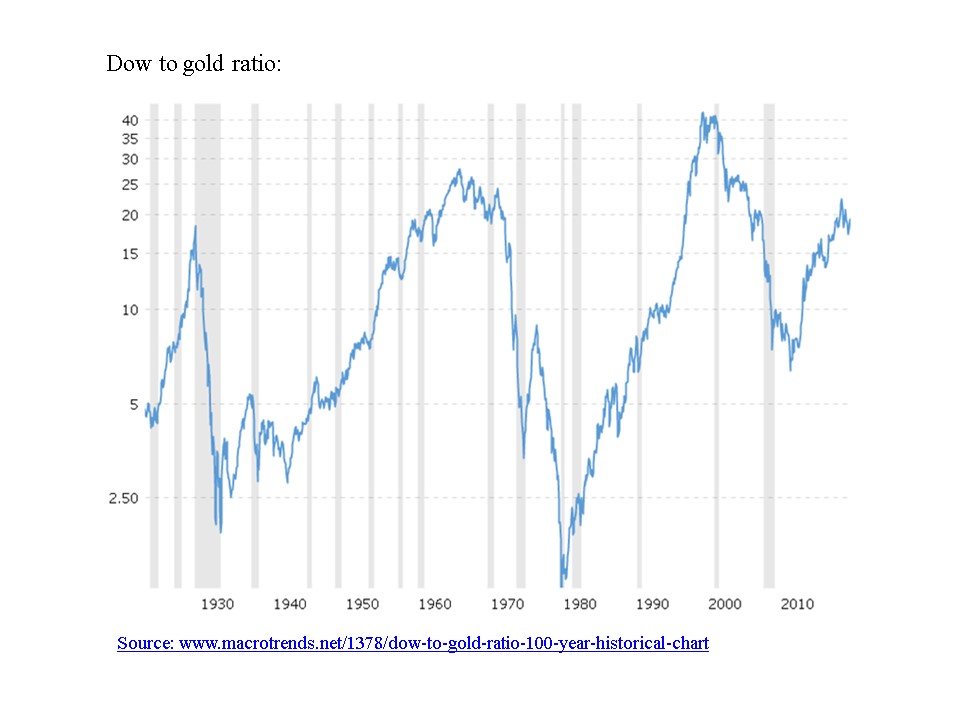
Speaking of precious metals, let’s look at the Dow in terms of how many Troy ounces of gold are required to buy it, which is also known as the Dow to gold ratio. I’m using the Dow given its longer historical significance than the S&P 500, but the result won’t be too different. Taking the Dow and dividing it by an ounce of gold gives us a sense of how expensive the Dow is in gold terms, and how attractively priced gold is currently in stock terms. Note that we are much closer to a record high in the Dow compared to the gold price than to a record low. Translation: in gold terms – and, by extension, silver – the Dow is very expense, and gold is very cheap. Have a look:
For flavor, if the dollar gold price reached parity to the Dow’s current valuation, which it nearly did in the 1930s and did achieve in the 1980s (please see chart above), today’s gold price would be over $28,000 per Troy ounce. If, on the other hand, the Dow imploded by 64% to 10,000, which would I think could easily happen given what’s “on offer” as frequently described, including here, Dow to gold parity would yield a $10,000 price per Troy ounce of gold.
Whichever scenario prevails, and I think the $10,000 gold price per Troy ounce is more likely than the former, gold should see a marked rise from its current USD price per Troy ounce.
Finally, note that PM are negatively correlated to stocks and bonds, and that the coming financial, economic, political, and societal tsunami will prick both confidence and bubble asset prices while triggering a reallocation into the only true safe investable portfolio harbors, incredible scarce gold and silver.
In a related manner, let’s consider where the S&P 500 is trading, in terms of a trailing 12-month P/E based on GAAP (all charges related to business lines being carried forward on board) earnings: how does a P/E ratio of 24 grab you?
Yet we have one after another sign of gathering economic weakness, be it in industrial output, in transportation, in services, in consumer spending, or in global trade. In other words, what I have been drawing your attention to for months suggests a sharp fall off in S&P 500 EPS is just down the road, something that a record long economic expansion of 10 years makes even more likely. Why? Because we always have business cycles. Call it a law of economic nature. Or call it human behavior; we always repeat the same mistakes, and then pick up the pieces, which is still in front of us.
Let me restate that YOY S&P 500 EPS momentum has already dissipated and went nominally negative in Q3:19. When GDP growth goes negative just slightly, S&P 500 EPS residuals get walloped. I’m talking 50% plus compressions being typical. And then staying down for the count, as happened last time around, when it took some five years for EPS to recover the prior peak levels. This time around, with all our even much greater debt and misallocations-based baggage on board, as well as the pronounced financial engineering/stock buyback-based nature of the current EPS pinnacle, EPS may have an even harder time coming back, much less eclipsing the current S&P 500 EPS total.
I’m trying to say that this makes the current S&P 500 P/E of 24 that much more precarious. Why? Because the stock market’s current bubble valuation is susceptible to a two-pronged deflation: first, a 50% plus EPS compression, which would cut the S&P 500’s current quote of nearly 3,200 in half or more all by itself, i.e., assuming a 24 multiple could be sustained. Second, with interest rates artificially on the financial repression floor amidst mounting default and monetary inflation risks, stocks’ NPVs will not only get clocked by an EPS compression, but by substantially higher discount/interest rates, themselves reflecting the ultimate end and reversal of a 38-year bond bull market.
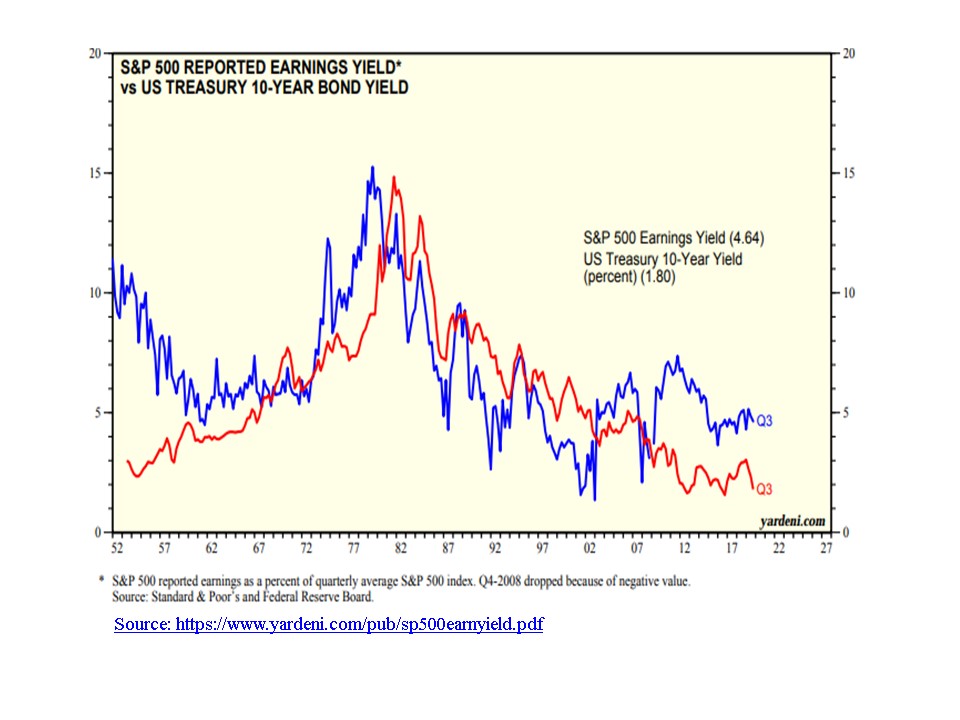
What’s the takeaway for investors? That stocks and bonds travel together, that is, they rise and fall together. Have a look:
Today’s bubble valuations of both bonds and stocks stands in stark contrast to our deeply “grey sky” scenario, which includes unparalleled debt, imploding productivity growth, grotesque misallocations, bureaucratic compliance tyranny, bureaucratic extortion, rampant cronyism, increasingly less protected property rights (just complying with the federal bureaucracy’s red tape costs US businesses $1.9trn a year, nearly 10% of US GDP), and manifest monetary inflation risks. Call it a financial repression-engendered disconnect. Call it a huge opportunity for those that bought bonds and stocks at inflated prices to sell with intact capital. Call it a huge upcoming bargain store (please see chart above) moving ever closer, which will then likely bestow on investors a once-in-a-lifetime purchase opportunity in which outsized return potential is positively correlated to lower capital impairment risk – sorry, MPT balderdash about risk and return always being positively correlated. For even more clarity, just see the chart above.
I hope this video has provided you with some useful allocation food for thought. I thank you for tuning in, and I wish you and your family a Merry, reflective Xmas filled with quality time together. I also wish you a prosperous, happy, and most of all healthy 2020!
This is Dan Kurz, December 19, 2019, signing off. Oh wait, before I do that, let me tell you that that the viewer lift that I’ve gotten thanks to being a squatter on SGT Report’s website (and various other high-quality alt media or alt investment sites) is sunsetting. Therefore, it will be this micro channel/micro site on their own. No more viewer training wheels (actually and most surprisingly, Sean of SGT saw fit to give the video this transcript references one more link “for the road” boost, for which I am most grateful!). See you next year, perhaps?
Boilerplate:
This transcript of a recent video is not intended as investment advice or as an investment recommendation. Past performance is not a guarantee of future results. Price and yield are subject to daily change and as of the specified date. Information provided is solely the opinion of the author at the time of writing. Nothing in the commentary should be construed as a solicitation to buy or sell securities. Information provided has been prepared from sources deemed to be reliable but is not a complete summary or statement of all available data necessary for making an investment decision. Liquid securities can fall in value.
