DK Analytics, Post #47: With rising interest rates, if you must buy, purchase “value” vs. “growth” stocks — AND THEN SOME 9/20/2018
Trade weighted US$: 90.03; US 10-yr: 3.08%; S&P 500: 2,908; Oil: $71.66; Gold: $1,212; Silver: $14.34
A historical interest rate perspective — the US & the world have never been so indebted in both relative to GDP and in absolute terms, yet look at our interest rates:
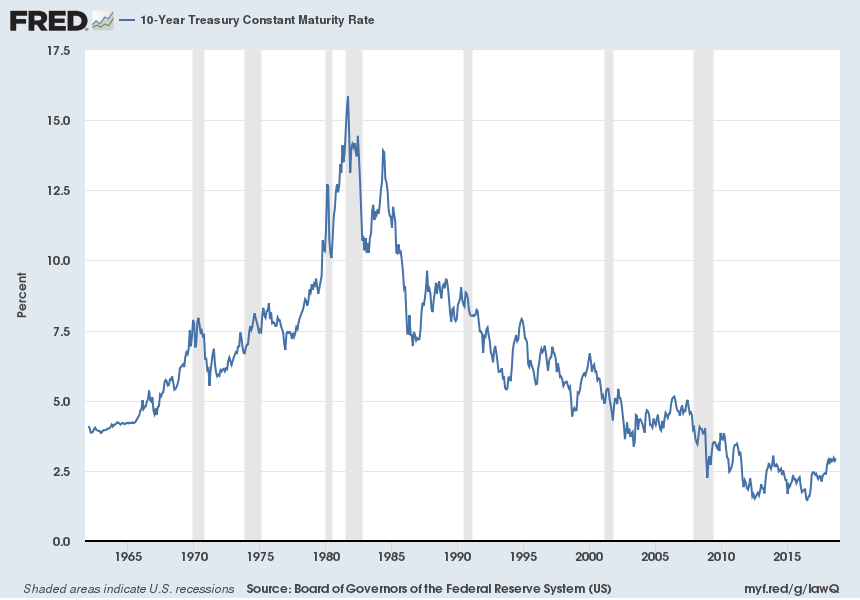
Source: https://fred.stlouisfed.org/series/DGS10
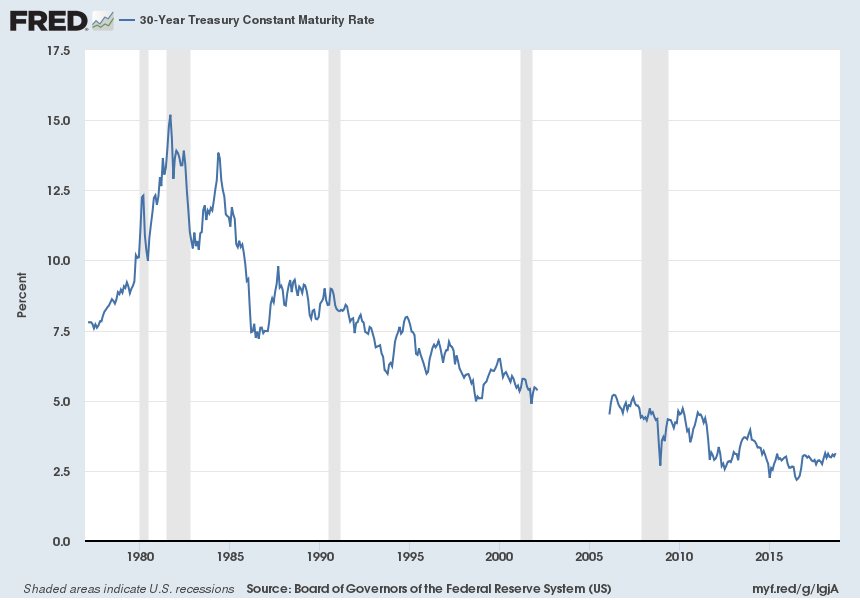
Source: https://fred.stlouisfed.org/series/DGS30
The real risk-free rate since 1311 (translation: risk-free, inflation-adjusted borrowing cost or interest rate)
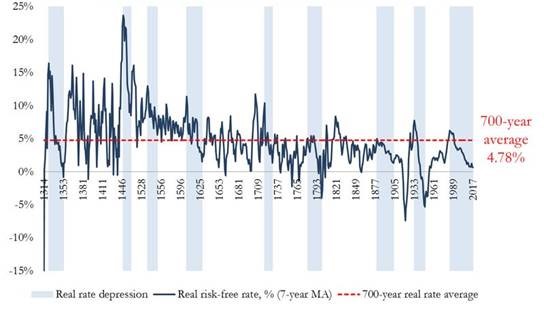
Source: www.bloomberg.com/news/articles/2017-11-07/centuries-of-data-forewarn-of-rapid-reversal-from-low-interest-rates. For flavor of what higher discount rates would do to the current S&P 500 valuations, click here.
First, after a decade of global financial repression now reversing, US stocks (and part of the world’s) are pricey prior to an overdue recession that should pummel EPS:
S&P 500 P/E based on trailing 12-month GAAP EPS
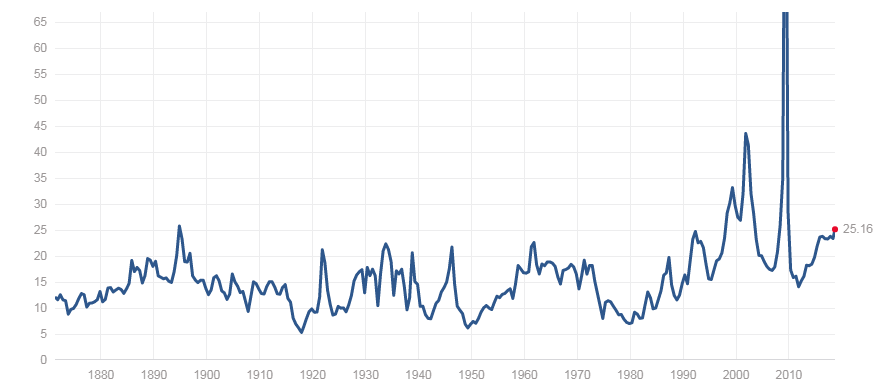
Source: http://www.multpl.com/ Mean P/E: 15.73; Median P/E: 14.73; Min P/E: 5.31 (Dec 1917); Max P/E: 123.73 (May 2009)
In terms of the 25 P/E multiple, consider that S&P 500 EPS are being legislatively “juiced” (lower tax receipts amidst record and growing federal government spending) into very transitory double-digit growth. Contrast this with from otherwise very pedestrian, low single-digit GAAP-based EPS growth between 2006 and 2017 (p. 2).
In particular, that “juice” is coming from a pronounced one-time reduction in the combined corporate tax rate (when considering federal and state levies, from nearly 40% to 25%), from massive profit repatriation under a lower repatriation tax (in the main, 15.5% vs. 35%), and from the ensuing record, possibly $1trn plus, repatriation-fueled stock buybacks. Upshot: 2018 S&P 500 EPS, which are tabulating stout 18% year-over-year growth through Q2:2018, would be much lower — and the S&P 500 P/E would be much higher — were it not for these unsustainable (one-time) developments.
This is thrown into sharp relief when examining the lackluster average EPS growth of 2.8% p.a. between 2006 and 2017. Punk average GAAP (“true”) EPS expansion has long lacked stout organic (top-line) growth, which is unsurprising for nominal annualized EPS growth cannot consistently outstrip nominal annual GDP growth (slide 3), an “econ 101” given. What is more embarrassing, and also frankly foreboding, is that despite unprecedented a) debt-financed share buybacks with “cheap money” that are looking eerily like “public LBOs,” b) domestic personnel reductions, and c) stagnant nominal cap ex and the ensuing moderating depreciation expense (in a nutshell, “corporate anorexia“), 2.8% EPS compounding was the best that a massively overpaid, stripped of parallel strategic interests “C-Suite” could “conjure up” from 2006 to 2017. (And yes, Virginia, we do have to deal with EPS eviscerating recessions, which haven’t been render obsolete, and with huge restructuring charges in continuing business lines, when looking at longer-term EPS compounding.)
The financial engineering-driven (versus real engineering-paced), anorexic, American C-Suite legacy threatens to magnify EPS compression prospects during the next recession from both corporate debt encumbrance and from weak product portfolio vigor perspectives. A run-of-the-mill, 40% -50% EPS reduction, magnified by the ephemeral tax rate reduction and repatriation-driven “shooting star” EPS surge we’re witnessing, might be substantially exceeded to the downside, and stock buybacks at bubble levels will invariably (again) be followed by EPS diluting secondary stock offerings at “bust” stock prices, adding insult to thinning earnings slice injury.
Second, as bond and stock valuations are tied at the hip, rising rates have a similar impact — “bonds and stocks travel together:”
- An increase in the return sought will cause a reduction in the NPV of the benchmark bond (the 10-year Treasury). This is expressed as a rising bond yield and a falling bond price.
- The same holds true for stock valuations/NPVs. When the discount rate (benchmark interest rate plus risk premium) rises, P/Es and stock prices (S&P 500) fall, and the “E/P,” or “earnings yield,” rises.
- Thus earnings yields and bond yields move in tandem:
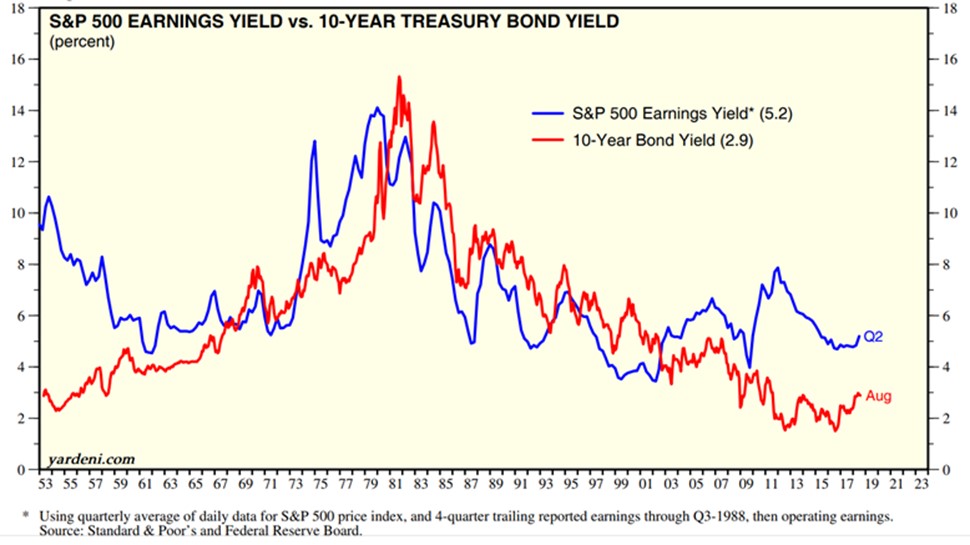
Source: www.yardeni.com/pub/sp500trailpe.pdf
Please note: if yardeni.com had continued to use appropriate, GAAP-based S&P 500 EPS, instead of bloated/devoid of recurring restructuring charges EPS as of Q3:1988, the mid-September 2018 four-quarter trailing E/P — or earnings yield — of the S&P 500 would be 4.0%, not 5.2%, as stated in the above chart. Looked at another way, investors should be seeing a S&P 500 P/E of 25.2, not 19.3, as a 5.2% E/P implies. And, BTW, all those analysts claiming that recurring restructuring charges (delayed, typically massive expense recognition in continuing business lines also known as “big bath accounting”) can be “ignored” when examining EPS also eagerly tout the higher ROEs achieved thanks to the charges-based equity hits, which obviously magnify future returns on equity! How does one spell “hypocritical” or “disingenuous?” Fortunately, the market can see through some of this, which is why banks and other financial entities prone to large periodic loan or asset write-downs are typically awarded only niggardly P/E valuations.
Beyond understated P/Es and overstated earnings yields, and of arguably useful historical valuation insight given a more virulent form of stagflation (’70s on steroids) that we are steering toward, note that approximately a year prior to the height of the bond market collapse in September of 1981 (the 10-year Treasury’s yield reached 15.2%), the S&P E/P (earnings yield) topped out at a staggering 14%! A S&P 500 E/P of 14 is the equivalent of a P/E of 7.1, a mere 28% of today’s S&P 500 P/E of 25.2. Such a valuation, which I strongly believe is a preview of coming attractions given our political (cratering trust/confidence possibly dead ahead given widespread lawlessness by those controlling the levers of power being exposed), financial (unparalleled global QE, financial repression-enabled debt mountains, and $21trn in unaccounted and unappropriated US government spending), and economic (faltering productivity and rising inflation) “landscape,” will bestow upon equity investors a “generational” buying opportunity.
Caveat: the upcoming equity bear market may well be of a very protracted nature. Nevertheless, outsized returns are made “in the buying,” meaning purchasing select “survivor,” big cap, crony, and/or vital resource stocks (in essence, S&P 500 type shares) featuring single-digit P/Es, double-digit dividend yields, and relatively robust odds that dividend payments can a) be maintained and b) be sustained at current levels, or at least at a substantial fraction (say over 50%) of current levels. This kind of “late ’70s/early ’80s” buying opportunity, when stocks were panned, will be revisited, we believe sooner rather than later.
Third, if you absolutely must buy (we’d wait for widespread bargains), lower P/E value stocks are less susceptible to rising rates than high P/E growth stocks:
During periods of rising interest rates (and let’s not forget that we have reversion beyond the mean, not reversion to the mean!), especially from historically very low levels such as today, investors, to the extent that they: a) have to remain invested in stocks and/or b) have “recent vintage/expensive” exposure to a very overvalued stock market, ought to shift equity exposure into value (lower normalized P/E) stocks from growth (high normalized P/E) stocks. Very importantly, investors in Blue Chips that offer high or very high dividend yields thanks to low historical acquisition costs (low split-adjusted stock prices), or in established growth stocks with low P/Es thanks to low comparative purchase prices that date back a decade or decades ago, should stay put! You already have what others are waiting for, so don’t sell; you wouldn’t sell a delightful, spacious home that you purchased for $38K in leafy, beautiful Niskayuna, NY (where I grew up) just because similar houses are fetching $250K – $300K, because you have already locked in a low cost base, save for “criminal,” perpetually rising (way beyond inflation) property taxes, which would admittedly dilute the validity of this comparison, but not the big picture point.
In a few sentences, and a bit oversimplified but arguably a good starting point for your own analysis for those requiring “perennial equity exposure,” part with FAANG stocks with a current average P/E exceeding 100 and examine the few relatively attractively valued, relatively low P/E names still out there for possible purchase (you’ll need patience, and most will typically go lower after you’ve taken your initial position, so if fundamentals unfold constructively, “dollar average down”). Given the likely economic, financial, and wrenching political/geopolitical storm that we are stepping ever more deeply into, focus on cash flow-stout big caps in out-of-favor industries with strong K-Street ties that have gotten slammed, and hopefully for the wrong reasons, at least strategically speaking. The reasons for this are straightforward:
- The NPV (net present value) or the market cap of lower P/E stocks is less susceptible to compression thanks to the fact that current or near future EPS are high relative to the stock price.
- The opposite is true with growth stocks featuring puny current earnings power compared to the stock price (high P/Es). Here, investors are betting on very significant future EPS growth.
- When investors discount back a “growth stock” EPS bonanza that will lead to a more reasonable P/E years down the road, it’s not too different from valuing a very low-yielding 10-year Treasury, a 30-year Treasury, or even a 15-year zero coupon bond. Reason: something called “duration,” which is the weighted average term to maturity of the cash flows. In the vernacular: the further out beefy EPS residuals are, the more susceptible the stock price (the NPV) is to shifts in the discount rate — an interest rate plus a risk premium (shareholders’ bottom line is known to dip into the red while bondholders get paid in full short of bankruptcy reorgs, thus the risk premium).
- A great rule of thumb: purchase growth stocks (long-duration, high P/E, huge multiple of book value equities) when inflation and interest rates are high, and sell them when they are low (as in now). Contrarily, buy value stocks (low P/E and low price/book ratio equities) when inflation and interest rates bottom out (as appears to be the case today) and sell them when inflation is surging, and interest rates are heading higher).
Motley Fool recently highlighted “bludgeoned” value names, courtesy of their valuation screens, which spat out AT&T, Horizon Pharma, and “Mickey Mouse.” T & DIS trade for a whopping 40% discount — or a P/E of 15 — to the current S&P 500 multiple. Such equities are great places to begin due diligence efforts for qualified investors, who also require at least a modicum of diversification (don’t just buy one!).
With a few keystrokes devoted to a cursory glance at potential “value names,” let me now take a stab at the NPV impact from rising discount rates (benchmark interest rates plus a risk premium for losses and total loss of capital risks) on a value stock and on a growth stock. The point: to give readers a top-down glimpse into value and growth stock valuations (NPVs, or stock prices) during a secular bond bear market. Based on history, bond bear markets (rising yields) can extend for decades. Note that our current bond bull market is 37 years old.
First the “hit” from higher discount rates to a hopefully somewhat representative value stock (in today’s nosebleed valuation stock market). Below that, the same rising discount rate math “hit” on a hopefully somewhat representative growth stock in the same bubble valuation market. Clearly, nominal EPS growth expectations can be altered with considerable NPV effect. That said, I’ve tried to use at least somewhat realistic EPS compounding assumptions on the value and “established” growth stock fronts over a span of three decades (more details on this in the calculations below as well as in the closing remarks).
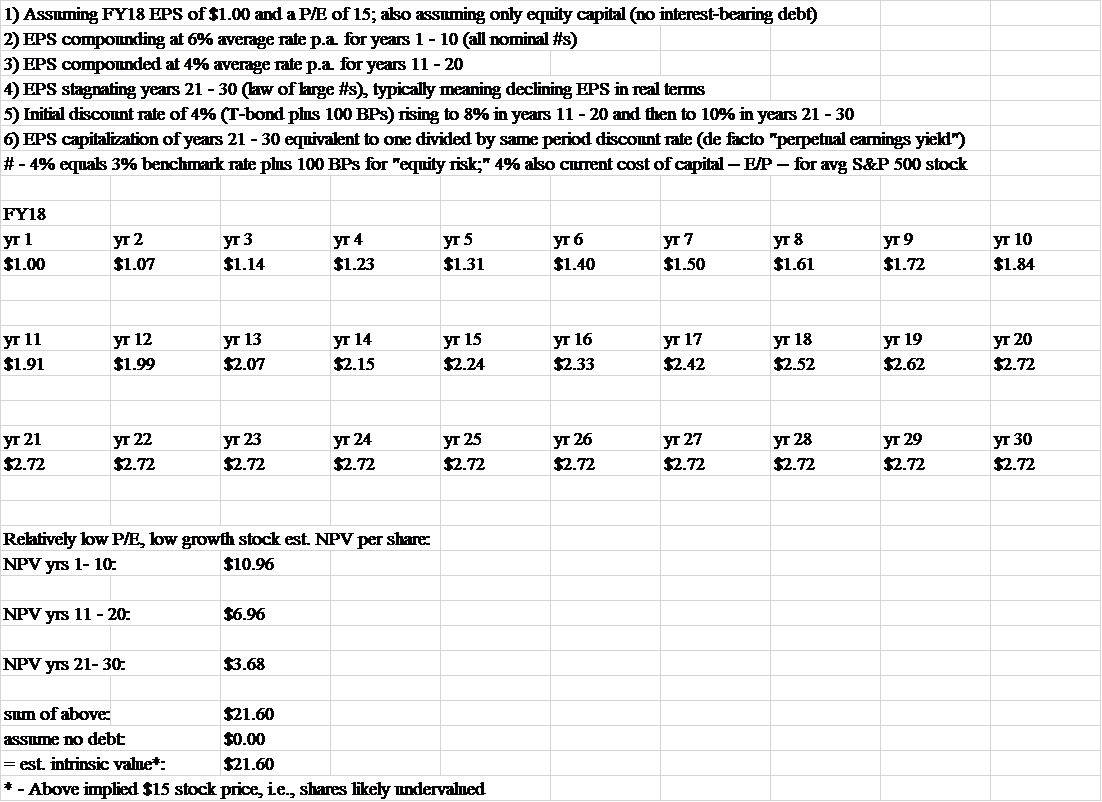
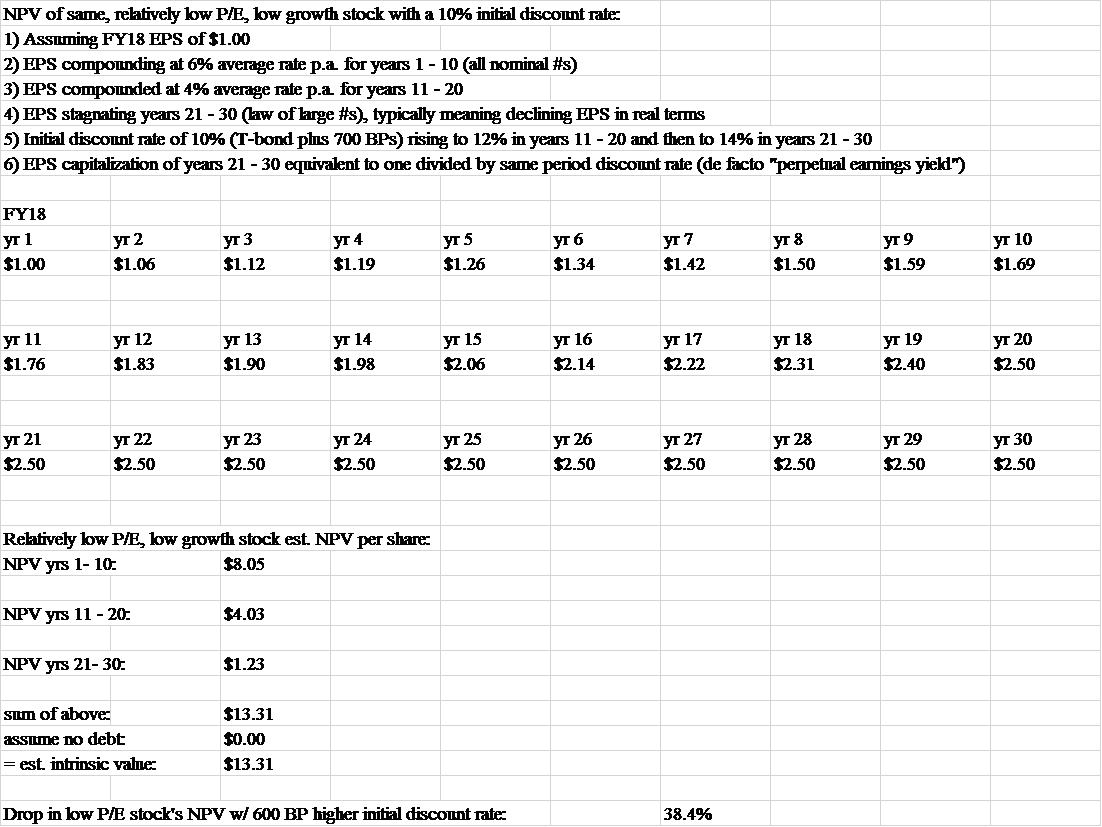
The value stock’s price compression in a pronounced bond bear market that has the discount rate going from 4% (30-year Treasury yield plus 100 BPs) to 10% (note that the 30-year Treasury reached 15.2% in September 1981) results in a 38% stock price (NPV/estimated intrinsic value) decline. On the growth stock front, the same discount rate dynamic pushes the stock price’s estimated intrinsic value/NPV down by 48%. I have not tried to capture the reduced economic growth much higher interest rates in a highly indebted economy would cause, but I have called this out in post #42. Suffice it to say that lower shareholder EPS growth would be likely in an environment where new creditors would experience nominal (and ultimately real) yield deprivation relief, i.e., some version of the “1981 stagflation protestation pinnacle, revisited.” And this is prior to any potentially metastasizing trade war, which would have profound inflationary (QE responses) and recessionary — or at least stagflationary — implications.
The resulting NPV calculations are solely efforts to give a sense of the magnitude of stock price compressions from sharply rising discount rates for value and growth stocks. This “top-down” exercise incorporates the impact of stoutly rising — but not historically unprecedented (especially when considering much, much lower US and global public indebtedness in the early ’80s) — interest rates on stock prices in NPV terms. In so doing, the discount rate increase assumption is beyond that was used in an earlier piece on this topic (post #25), which dealt with the S&P 500 Index. The reason: individual stocks obviously carry much higher risks than the S&P 500 as a whole from a host of perspectives. The calculations:
| NPV of relatively low P/E, low growth (value) stock currently trading at $15 with a 4% initial discount rate#: |
| NPV of high P/E growth stock with a current “Russell 2000” 59 P/E or $59 valuation with a 4% initial discount rate#: |
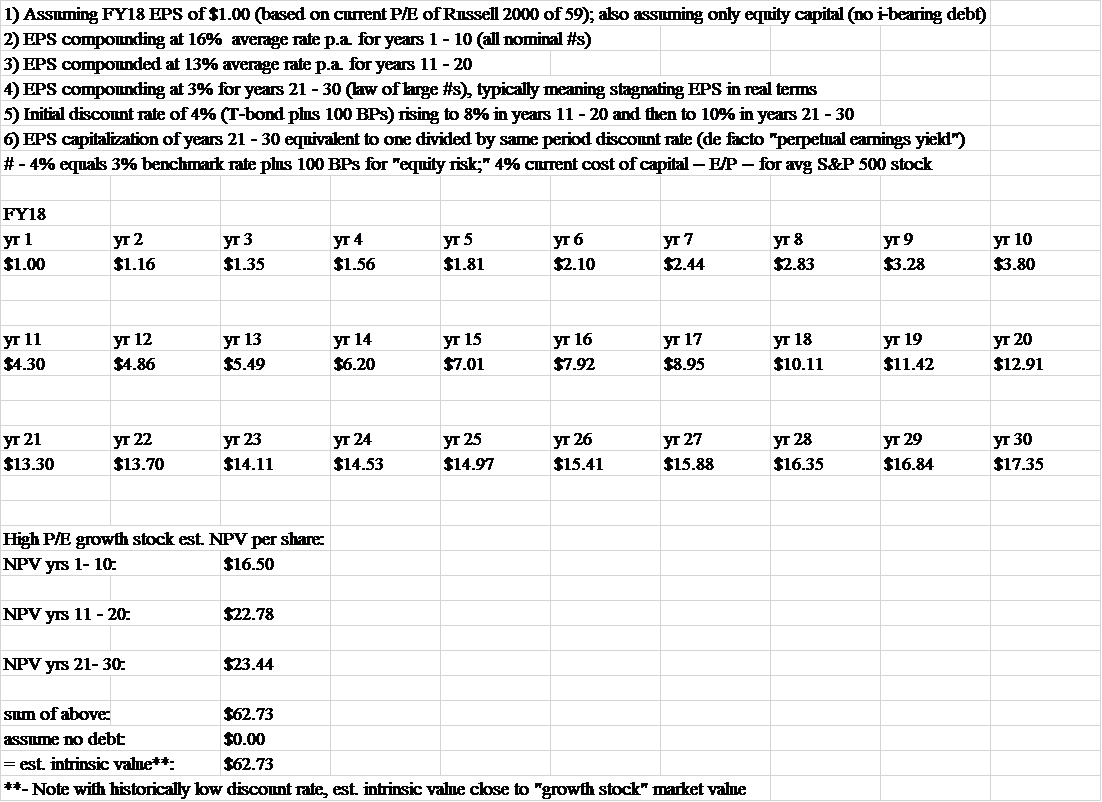
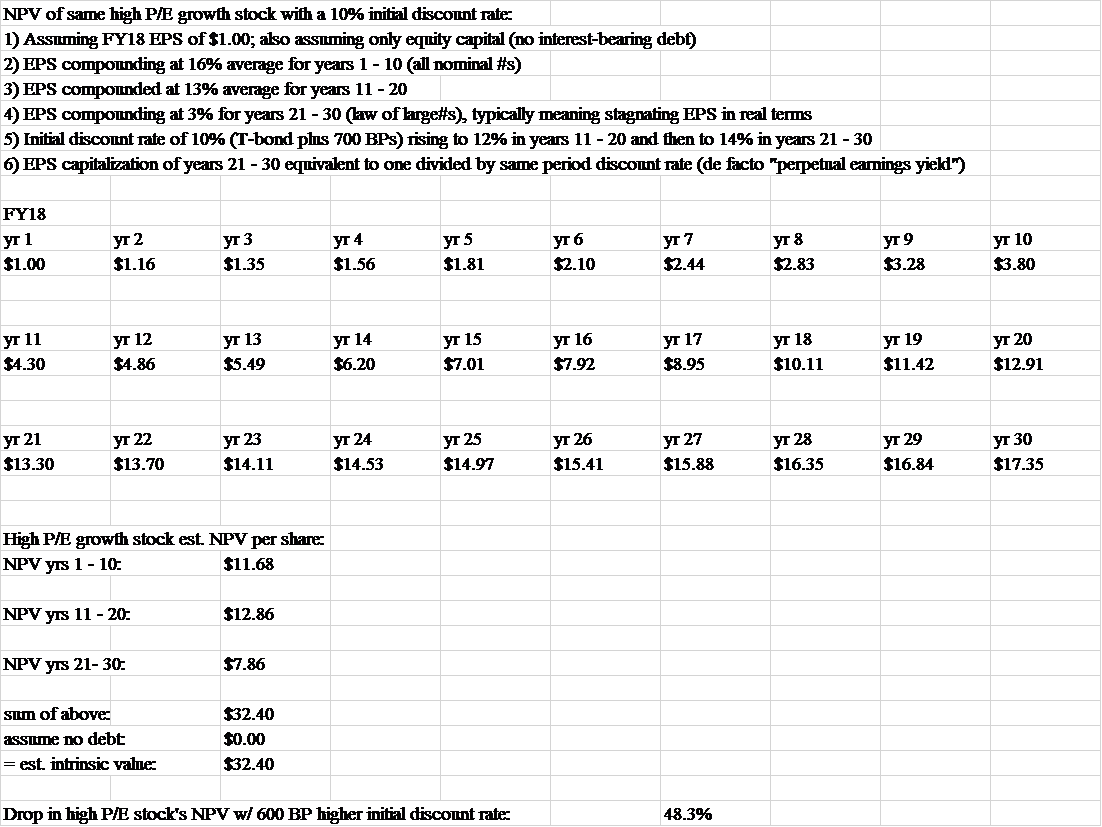
Source: author calculations using Excel financial functions combined with author EPS growth and interest rate/discount rate assumptions
The bigger point, revisited — and expanded:
The bigger point, as addressed both above and with considerable detail in post #25, is that rising interest rates — and the discount rates on which they are based — will punish both bond and stock valuations as they are both discounting mechanisms. This is equally true for most other assets, including mortgage-encumbered real estate and leases of all virtually all sorts. Discount rates, or benchmark rates with shareholder premiums on top, could fatten substantially beyond benchmark rate increases. We haven’t dialed this in; we have, however, assumed a stout bear market in bonds without assuming a reversion beyond the mean, ’70s-style bust. But a fattening discount rate is exactly how we got a 14% earnings yield on the S&P 500 some 39 years ago (figure 8), as the S&P 500 earnings yield (E/P) raced ahead of the 10-year Treasury yield from the early ’70s to the late ’70s, only to be finally “eclipsed” by a raging bond bear market thereafter.
Outsized discount rate expansion (beyond benchmark interest rate increases) would be particularly true should generational “shareholder equity enchantment” morph into generational “shareholder equity disenchantment.” Disenchantment would surely beckon if rising discount rates were also accompanied by “beyond the mean reversion” of an increasingly unsustainable, 37-year rise in net US corporate profits as a percent of US domestic income (essentially the flip side of GDP; please see chart below), setting the stage for a “dual-tier” stock value compression.
Noteworthy, and unsurprisingly, four decades of rising American corporate profits are juxtaposed against a 45-year slide in compensation of US employees as a percent of US domestic income (“labor’s share;” please see second chart below). A sustained trend reversal here — despite all the AI and robotics worker displacement/termination headlines, which frankly remind this author of how the ag revolution was going to permanently wipe out income for most Americans, most of which worked on farms at that time — would constitute secular profit pressure. This would amount to a shareholder double-whammy if accompanied by rising discount rates. (Or perhaps if machines render a huge portion of the workforce academic and thus unemployed, despite the millions of likely well-paid new jobs AI and robotics should result in, then maybe corporate taxes will need to surge to finance “universal income” or some such travesty, indirectly still leading to potentially lower corporate net profits, especially if this a global trend that renders “overseas labor outsourcing” obsolete. How does one spell “shareholder disenchantment.”)
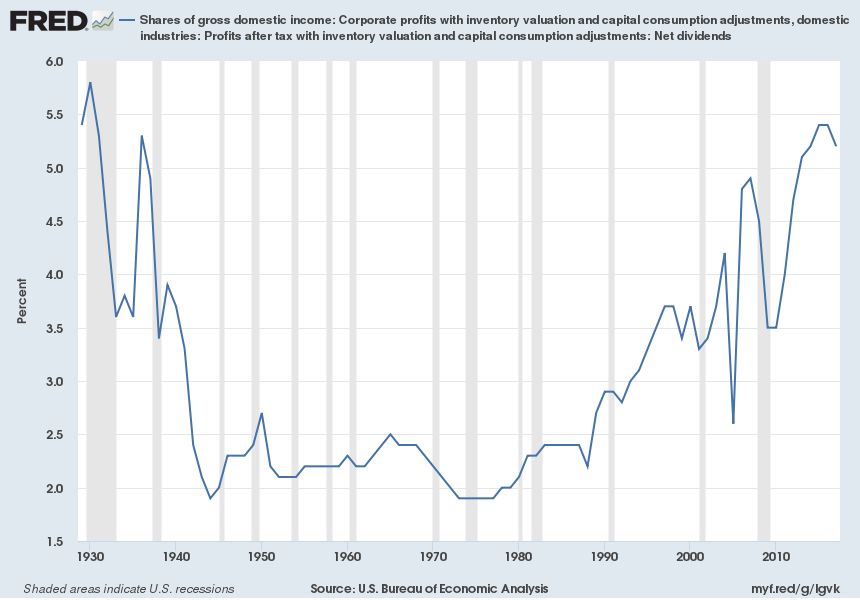
Source: https://fred.stlouisfed.org/series/A449RE1A156NBEA
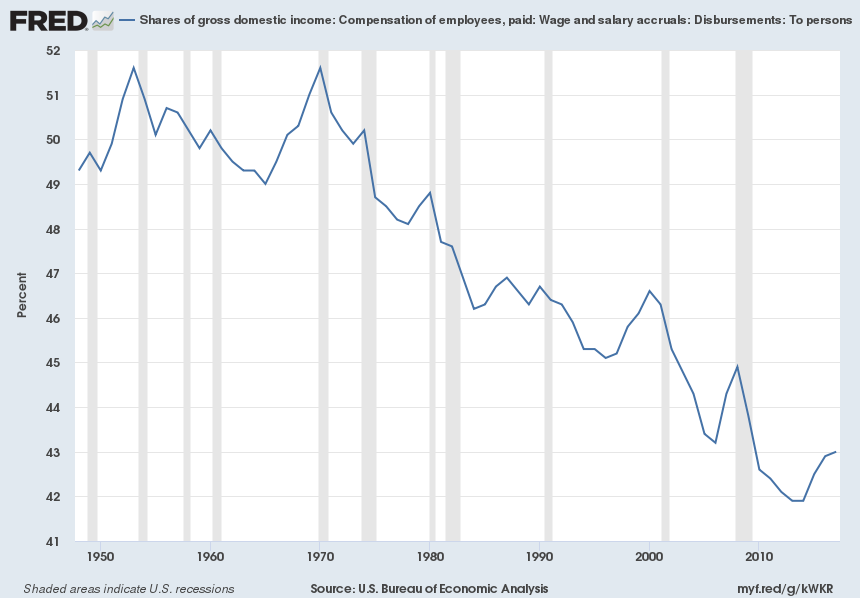
Such shareholder disenchantment, and the associated low P/Es, has happened in decades past for a decade, and sometimes considerably longer. With near-record low interest rates set to rise amidst sharply increased and absolutely unparalleled US and global solvency risks, the associated low growth risks, and much higher QE-induced misallocation and monetary inflation risks, value stock market caps should suffer less than growth stock market caps.
Last but not least as regards the bigger point theme, I’d be remiss if I didn’t call out the humongous dense energy availability, affordability, and misallocation challenges that could render everything else discussed here and elsewhere academic. Those same challenges threaten the very leveraged output, much less (revisiting) sustained productivity advances, that are key to enabling continued robust shareholder returns on equity and solid returns for all capital providers, including the unprecedented amounts provided by creditors, many of which represent increasingly imperiled pensioners:
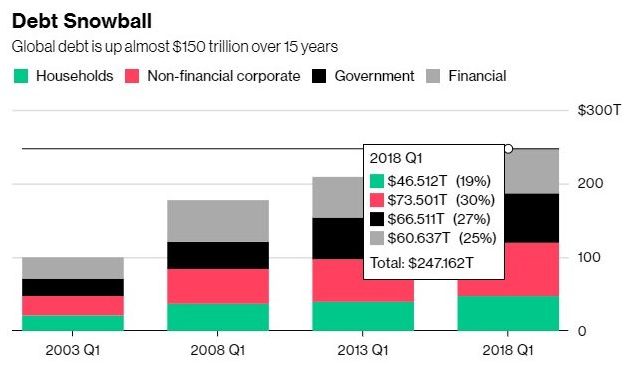
Sources: Institute of International Finance and www.bloomberg.com/news/articles/2018-07-10/global-debt-topped-247-trillion-in-the-first-quarter-iif-says
Caveats and closing thoughts:
To reiterate, both EPS growth and discount rate assumptions hugely impact NPV outcomes, making intrinsic value estimates derived therefrom rather tenuous. Plus, my 6% annual “value stock” EPS compounding during the first decade is more than double the S&P 500’s track record between 2006 and 2017 in the same realm. This “reach” is obviously not well supported by history. My only weak intellectual excuses are as follows: a) “negative news” or “event-driven” value stocks (probably the majority of value stocks in a vastly over-valued US stock market) will often exit under-performing business(es), which will tend to raise company-wide EPS growth rates for a time; and b), my the value stock NPV calculation is compared against a growth stock NPV calculation in which the growth stock EPS CAGR remains at an absolute nominal GDP growth trouncing high-to-mid-double-digits rate for two decades. A hugely imperfect and arguably flawed effort at an individual security level, but perhaps at least broadly indicative of the upcoming divergence between value and growth stock price compressions in an overdue bond bear market. Both types of shares will get clocked, but value stocks, as a group, will wilt (price-wise) less than growth stocks. I’ve tabulated a 38% hit vs. 48% hit, as you know. Still ugly, but considerably less so, which is precisely the point we’re trying to make. To get back to a “100 purchase price,” that value stock price would need to rise by 61%, while the growth stock price would have to nearly double (up 92%).
Some thoughts for those that “can’t wait to buy US stocks” prior to history repeating itself.
And while we’re on the topic of history repeating itself, we’d be remiss if we didn’t mention how incredibly ridiculous and dangerous today’s intimidating, potentially career-shredding, at times financially-ruinous PC world is for those that dare to make a stand against a popular, whipped-up narrative — fair discovery, full transparency, timely charges rendered, evidence, witnesses, and facts be damned. A world in which all too often “guilt” is assumed, rather than innocence. Innocence is THE key assumption/bedrock principle underpinning due process rights, the west’s legal system, and a fair, humane governmental system. Spreading political correctness is nothing other than suppression of free speech, and thus freedom. Thought tyranny leads, inevitably, to brass-knuckle tyranny. That is, history repeats.
For disturbing “Borking” flavor on precisely the above topic, consider the absolutely contemptible effort by the deeply corrupt, purely politically-driven left to keep Judge Kavanaugh from becoming SCOTUS Justice Kavanaugh. If a “last minute” effort to derail the confirmation of a highly qualified candidate with a multi-decade track record of constitutional fidelity when rendering decisions (what judges are supposed to do, i.e., endeavor to faithfully interpret the Constitution) is successful, then we are in even deeper political trouble than is already the case. This is all the more true if an utterly isolated abuse charge, dating back 36 years (purported unwanted sexual advances by then teenager Kavanaugh) by a woman that can barely remember any of the “shirt-groping” details and only recently came forward with this claim, ends up shutting down Kavanaugh’s confirmation/nomination. Insanity would rule, and a very high profile political lynching by “the mob” would set a very dangerous precedent.
With $21trn in unaccounted for US government spending pointing to $21trn in unaccounted for money, widespread lawlessness at the highest echelons of power, an ongoing coup attempt to remove a duly-elected president from office or to totally incapacitate him, and an increasingly encompassing effort to institute de facto one-party government (by the allegedly “out of power” Democrats as enabled all too often by statist RINOs) as currently on display with the Kavanaugh confirmation circus, confidence is not being furthered and trust is not being (re)instilled. All said, such goings-on further threaten a return to a reinvigorated rule of law, which is in deep, deep trouble (throughout the west). And, for the same political reasons, our bubble valuations, which are already disconnected from financial and economic sanity, are also in deep trouble. Investors assume stout rule of law protections, including in the all-important property right arena, which have long been under attack by the courts and the bureaucracy, both domestically as well as in other OECD nations. At some point, all of the sudden, trust will wilt, and asset prices will “catch up” with political, financial, and economic reality. Perhaps Trump’s recent, yet overdue declassification of key FISA documents will prove to be the catalyst that pulverizes confidence by disclosing the unparalleled bureaucratic (deep state) lawlessness that has been taking place. Caveat: only if the declassification is actually released for public review.
Which begs the question: how can one value assets in a de facto banana republic (from a host of perspectives, including numerous, top-tier, un-indicted felons on, or previously on, the taxpayer payroll that are still at large*), versus in a rule of law republic, other than with extreme caution, i.e., via high bond yields and low P/Es, the antithesis of today’s US asset valuation bubbles? How long will the bond vigilantes, the “algos,” and the so-called market technicians remain asleep at the switch; will the spreading contagion or an expanding trade war be the trigger that flips it? Or, will we have to await a US equity market swoon before the Fed’s QT morphs into unprecedented QE? This is the $64,000 question, especially with the Fed’s QT in nearly “full-blown,” $50bn p.m. asset sale mode amidst huge and growing debt, rising deficits, and crumbling EM market currencies, bonds, and stocks. (And crumbling EM economies are no longer able to hitch a ride on the erstwhile speeding “China growth train,” as that nation’s economic locomotive role has run into a $34trn wall of debt, a tally that has led to a 266% Chinese debt to Chinese GDP ratio as of the close of 2017, up explosively from 162% in 2008.)
How long until the US stock market succumbs to political, financial, and economic “valuation reality 101” and to an increasingly dicey global economy? And will the US stock market again lead the US bond market into a full-blown bust, just as it did in the ’70s (figure 8)?
Sincerely,
Dan Kurz, CFA
* – For absolutely outrageous “over-the-top” flavor, consider Hillary Clinton. The felonious former secretary of state destroyed massive amounts of evidence while gravely violating classified information security protocols with her private servers, and thus gravely threatened national security. Yet, she was effectively exonerated by former FBI head Comey, who had the temerity to a) usurp judicial power and b), at the 14-minute mark of his self-righteous July 5th, 2016 tirade on this matter, warn that “everyday” Americans, in contrast, would be held accountable: “this is not to suggest that in similar circumstances, a person who engaged in this activity would face no consequences!” (When there are two sets of laws, one for the mighty who stand above the law, another for the rest of us who have to abide by the law, a society by definition cannot have the rule of law.)
This commentary is not intended as investment advice or as an investment recommendation. Past performance is not a guarantee of future results. Price and yield are subject to daily change and as of the specified date. Information provided is solely the opinion of the author at the time of writing. Nothing in the commentary should be construed as a solicitation to buy or sell securities. Information provided has been prepared from sources deemed to be reliable but is not a complete summary or statement of all available data necessary for making an investment decision. Liquid securities can fall in value.
